Report: 5.8 Million Knocks: A Three-Year Honeypot Record of SSH and Telnet Attacks
Unsolicited traffic runs on a steady base with spikes on top of it. In a quiet month, the honeypot receives about 25,000 scans and 75,000 to 80,000 attacks (together, about 100,000 connections), and a typical month brings about 28,000 scans and 105,000 attacks, as shown in Figure 3. Scans are the steadier of the two, apart from two surges, in June 2025 and May 2026. Attacks swing more and have been elevated since late May 2026, at levels comparable to late 2023 and early 2024. There is no discernible long-term trend in scans, attacks or their total.
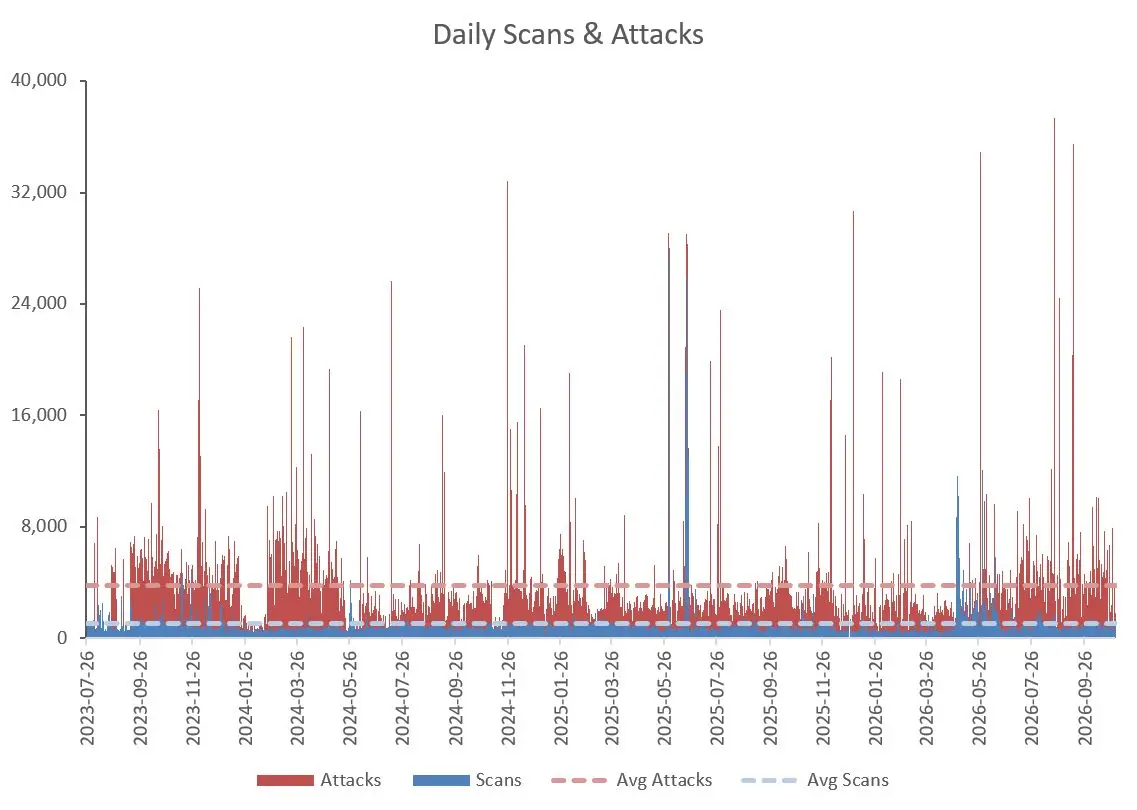
Figure 1. Daily trend of scans and attacks
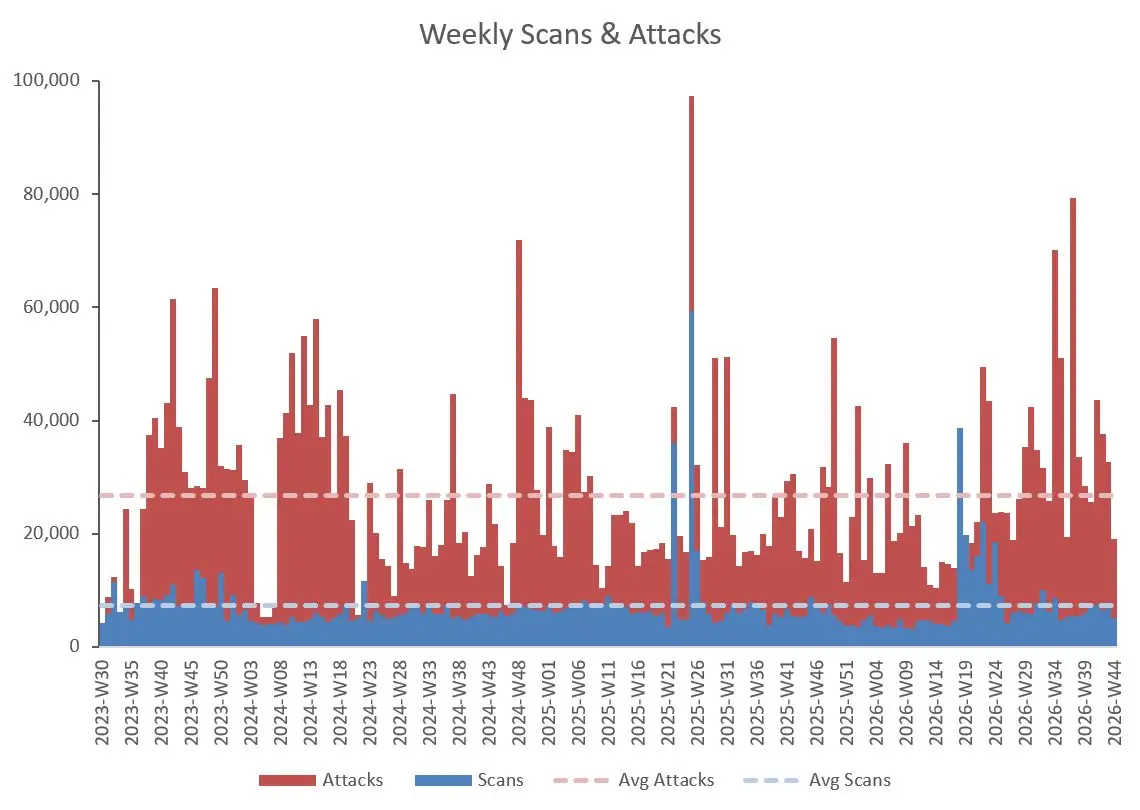
Figure 2. Weekly trend of scans and attacks
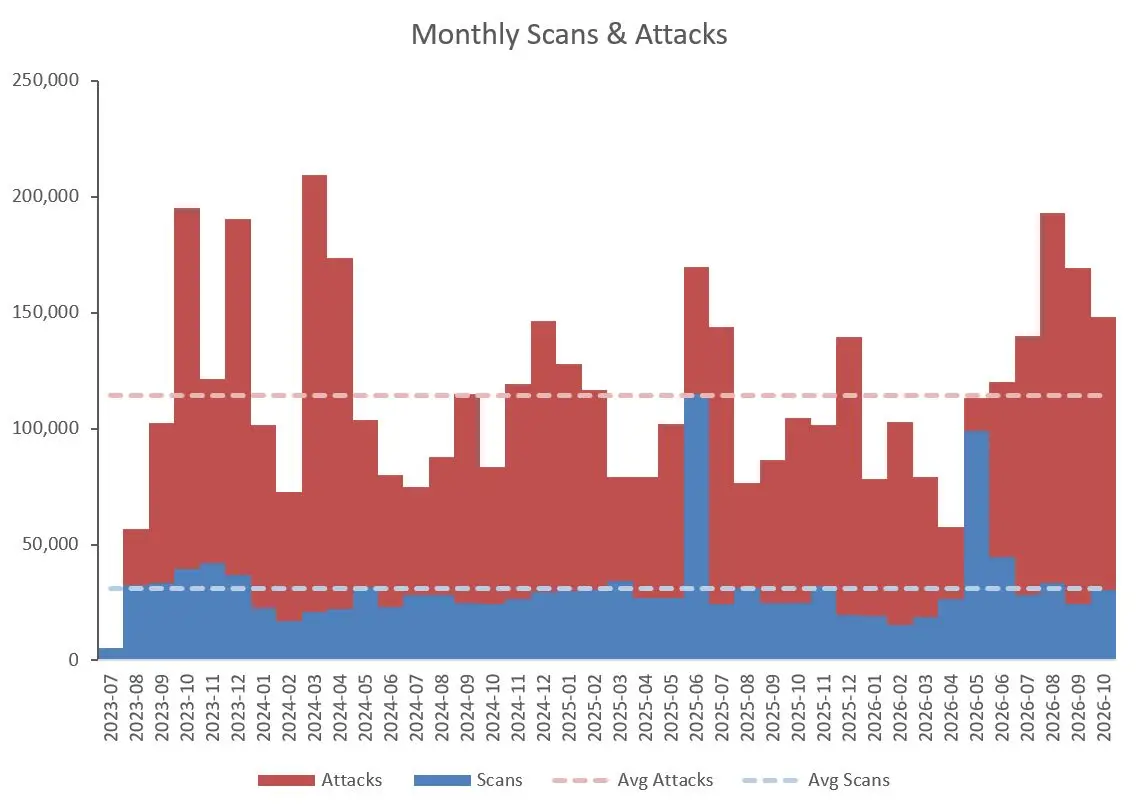
Figure 3. Monthly trend of scans and attacks
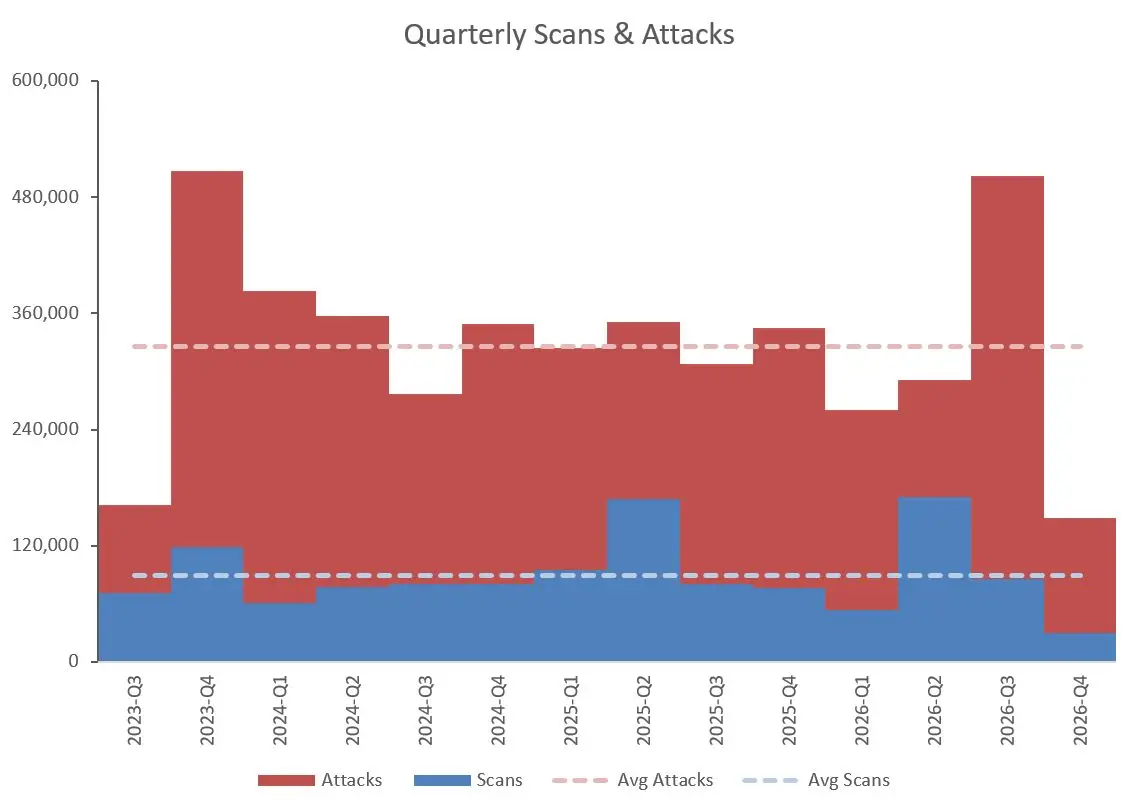
Figure 4. Quarterly trend of scans and attacks
Scans hold a floor of about 820 a day (median 818 a day), and 80% of days fall between roughly 530 and 1,370 scans, as shown in Figure 1. For completeness, weekly and quarterly trends are shown as Figure 2 and Figure 4, respectively.
What the trends show:
-
Scans form a steady base with two surges. Of the 39 full months, 37 fall between 15,000 and 45,000 scans (median 28,000; the quietest quarter of months had 24,300 or fewer). The exceptions are June 2025 (114,908) and May 2026 (99,029), about 4.1 and 3.5 times the median. The surges have different shapes. June 2025 is six days in two bursts (May 31 to Jun 1 and Jun 20 to 23, 100,776 scans). The 2026 surge is a six-week plateau (Apr 30 to Jun 14, 137,532 scans, 2,990 a day) that peaked on Apr 30 to May 3 and on May 30 and ended abruptly in late June. Eleven of the twelve largest scan days fall in these two episodes.
-
Attacks vary far more, around a stable floor. Monthly attacks range from 56,745 to 209,289. The quietest tenth of months had 76,000 or fewer, the median month 104,555 and the busiest tenth 177,000 or more. Month-to-month variation is about 1.5 times that of scans outside their two surges (coefficient of variation 0.35 against 0.24). The median day holds 2,883 attacks, the ten largest days carry only 6.8% of all attacks, and 32 of the 1,194 days topped 15,000.
-
There is no long-term trend. Monthly scans, attacks and their total show no significant drift in either direction (Kendall tau between -0.04 and 0.06, p-values above 0.58). Attacks averaged 3,733 a day in 2024, 3,637 in 2025 and 3,953 in January to October 2026, all within 9% of one another.
-
Attacks are not clearly higher now than in the past. Q3 2026 averaged 5,458 attacks a day, level with Q4 2023 (5,510) and above every quarter in between (2,889 to 4,212). August 2026 (6,226 a day) is the third-highest month, behind March 2024 (6,751) and October 2023 (6,299). The highest 28-day average (7,857, ending Sep 13, 2026) is only 9% above the earlier peak (7,201 in Q2 2024), and a third of that window’s attacks came on two days. Two of the five largest weeks fall in 2026 (September 7 with 79,284 attacks and August 17 with 70,149). Against the same months of earlier years, the 2026 level is far higher (August to October: 5,549 a day against 3,106 in 2024 and 2,911 in 2025), and against the long-run average of 3,823 a day Q3 2026 is 43% above. The current level is high, but it is within the range the series has already shown.
-
An elevated period began in late May 2026. From March 16 to May 10, weekly attacks held between 10,500 and 15,000, the longest low stretch since the 2023 start-up (eight weeks; the lowest 8-week average after the start-up, 13,554), and April’s 57,742 attacks was the lowest month since August 2023. The level stepped up in the week of May 25 (49,494 attacks). Since then, 20 of 22 full weeks have been at or above the median week (23,336 attacks), averaging 36,407 against 26,883 overall (+35%). Monthly attacks were 113,399 in May, 120,087 in June, 139,915 in July, 192,995 in August, 169,220 in September and 148,281 in October. Two qualifications apply. June weeks sat only just above the median (about 23,700), so the clearly elevated stretch begins in July (15 of 16 full weeks at or above the median, averaging 38,617). And earlier episodes lasted longer: 19 straight weeks at or above the median from Sep 11, 2023 to Jan 15, 2024 and 12 from Feb 19 to May 6, 2024, against blocks of 8 and 7 weeks in 2026, split by a single week of 19,519 attacks (Aug 31).
-
Total traffic keeps a floor near 100,000 connections a month. Monthly totals (scans plus attacks) never fell below 84,311 (April 2026) and were under 100,000 in only 5 of 39 months; the median is 136,120. Attacks are 78.5% of the total, so the total follows them, and it is only slightly steadier than attacks alone (coefficient of variation 0.32 against 0.35; scans alone 0.59). Scans and attacks barely move together (correlation 0.22 by month and 0.20 by day, falling to about zero once the six burst days of 2025 are removed), so their spikes arrive independently.
-
Attack troughs do not follow scans. Attacks stayed below 1,500 a day for a week or more in the 2023 start-up, from January 27 to February 16, 2024 (21 days, 784 a day), from May 21 to June 5, 2024 (16 days, 539 a day) and from March 26 to April 1, 2026 (7 days). Scans averaged 568 a day in the first of those 2024 troughs and 1,150 in the second. Recovery was fast after February 2024: the 7-day average was back above 4,000 by Feb 23, and March 2024 became the highest month of the period (6,751 a day). After June 2024 the rebound faded, and the 7-day average was back near 950 by July 11. A shallow trough from November 8 to 19, 2024 (941 a day) was followed by the largest attack day before 2026 (32,824 on Nov 25).
-
The honeypot start-up took seven weeks. The first 50 days (July 26 to September 13, 2023) averaged 1,357 attacks a day, with a median of only 333. On September 14, 2023 the level jumped, and from then to the end of the year attacks averaged 5,516 a day (median 4,977), about four times the start-up average. Averages that include these weeks understate the later baseline.
-
One of the two 2025 bursts involves IP01. The second 2025 burst covers four days (June 20 to 23) and holds 160,417 connections: 68,537 scans and 91,880 attacks. IP01 was the origin of 149,198 connections (93.0% of all): 65,989 scans (96.3%) and 83,269 attacks (90.6%).
Possible Explanations (Hypotheses)
The trend data show when things happened but not why. The ideas below are hypotheses that fit the pattern, not findings, and the daily counts alone cannot choose between them. Each ends with a test the honeypot or dashboard data could run.
Why scans are steady
-
Fixed-rate background scanning. Many actors sweep the whole IPv4 space on schedules that change slowly: research and exposure-mapping projects, device search engines such as Shodan and Censys, notification services such as Shadowserver, and the propagation code of botnets. Each address then receives a roughly constant stream of probes, which would explain the floor of about 820 scans a day, the narrow monthly band and the absence of a trend. It would also explain why scans are unrelated to attacks: at least 147,597 IPs (63.6% of all sources) only ever scanned. Test: split scan sources by network owner and by whether they ever attack; fixed-schedule scanners should repeat weekly or monthly.
-
Time-boxed campaigns cause the surges. The June 2025 bursts (one to four days each) and the six-week 2026 plateau, which decays and stops abruptly, look like finite jobs: a research or commercial scan project, or a botnet recruitment drive. The 2025 bursts may be one source (IP01). In 2026 the first peak (April 30 to May 3) fell on the days around CISA’s May 1 listing of the Linux “Copy Fail” flaw (CVE-2026-31431) as exploited, and a separate honeypot described in a SANS Internet Storm Center guest diary logged its own spike on May 2, which hints at an internet-wide event, not something specific to this sensor. The link is coincidence in time only: Copy Fail is a local privilege escalation, which would not by itself draw scans of the SSH port. Test: per-IP daily series for April 30 to Jun 14, 2026; whether those scanners share a network or SSH client fingerprint.
Why attacks vary without trending
-
Many campaigns switching on and off around a stable pool of targets. The ten busiest IPs account for only 7.9% of attacks, so volume is the sum of many bots, not a few heavy hitters. If the pool of guessable SSH hosts and the cost of attacking them change slowly (APNIC’s honeynet write-up notes that old, cheap-to-scan threats never disappear and that botnets dating from 2017 and 2020 still keep tens of thousands of machines attacking every week), attack volume should hover around a long-run level with episodes above and below it, as the series does, instead of trending. Test: weekly count of distinct attacking IPs; spikes from more IPs, not more attempts per IP, point to botnet size.
-
Controller-driven tasking produces one-day spikes. The SANS guest diary describes synchronized bursts from hosts in different countries that use the same SSH client fingerprint and throttled, uniform per-node rates, which its author reads as a controller assigning quotas to botnet nodes. Days such as August 22 and September 13, 2026 (37,375 and 35,515 attacks) are the kind of event such tasking could create. Test: SSH client fingerprints and credential lists on spike days against ordinary days.
-
Target lists, not organic growth, set this sensor’s level. Attackers choose targets from scan data and shared IP lists. The 4.1-fold step on September 14, 2023 looks like the sensor entering such lists, not gradual discovery, and the troughs (January to February 2024, May to June 2024, March to Apr 2026) could be the reverse: the address dropping out of lists, an operator pausing, or a major source network being cleaned up. The one outside honeypot found for the same months reported sustained high volume from March 9 to April 14, 2026, when this sensor was at its quietest, which fits sensor-specific effects, although a single home honeypot is thin evidence. Test: compare with a second sensor on a different address; shared steps and troughs would be internet-wide, unshared ones would be sensor-specific.
Why attacks are elevated since May 2026
-
Part rebound, part new activity. Some of the “elevated” impression is contrast with the spring trough: January to October 2026 as a whole averages 3,953 attacks a day, about 10% above the same months of 2024 (3,610) and 2025 (3,574). The rise from late May could be a lull ending (operators returning, infrastructure rebuilt, new credential lists) or a different actor adding volume. Test: weekly share of the 345gs5662d34 credential family and of the top file hash before and after May 2026; a new family or new fingerprint points to a new actor, an unchanged mix to the old botnet returning.
-
Source networks shift. Attacks come mainly from cloud and hosting networks (DigitalOcean alone accounts for 13.8%). A provider cleaning up or a new one being abused would move volume without any change in attacker behavior. Test: the dashboard’s month-by-month network view for May to October 2026 against earlier months.
Taken together, hypotheses 1 and 3 would produce the steady floor in the total: a stable scanner population and a stable population of persistent botnets, each roughly constant and largely independent, with discretionary campaigns (2, 4, 6) adding the spikes on top. What would help most is a per-IP daily series, network and credential-family counts by week, SSH client fingerprints by week and a second sensor on a different address.
Report: 5.8 Million Knocks: A Three-Year Honeypot Record of SSH and Telnet Attacks
Leave a Reply